
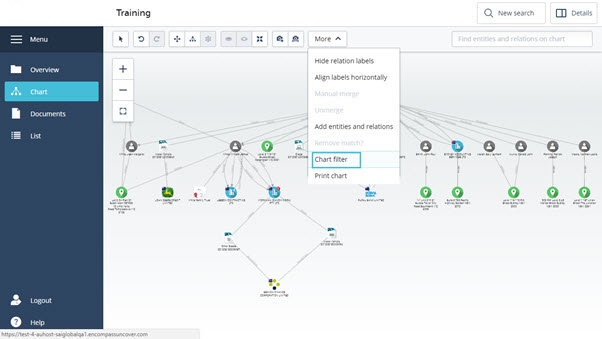
Encompass provides a powerful chart filtering paradigm to enable you to filter large datasets into manageable and distinct views of information. By clicking on the Chart Filter toolbar function (which you will find under the More button), you can open and close a Filtering panel on the left of the workspace.
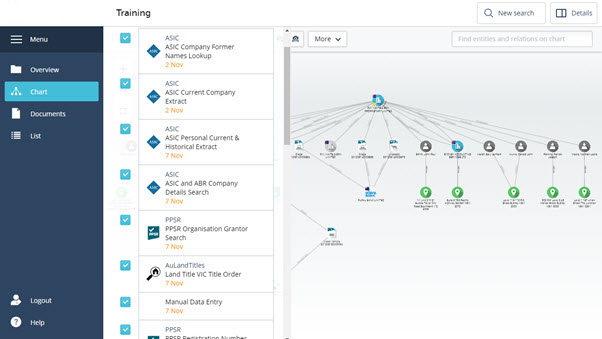
The Filter panel includes the Reports you have undertaken in the workspace, as well as any manual additions you have made, and a dynamic list of filter sets that are created based on the entities and their properties available in each report.
- Click the More button
- Select Chart Filter
At the top of the Panel you can expand the Reports section, and filter off an entire report.
- Uncheck one of the Reports to see the affect it has on your chart.
- Re-instate the Report
- Collapse the Report section
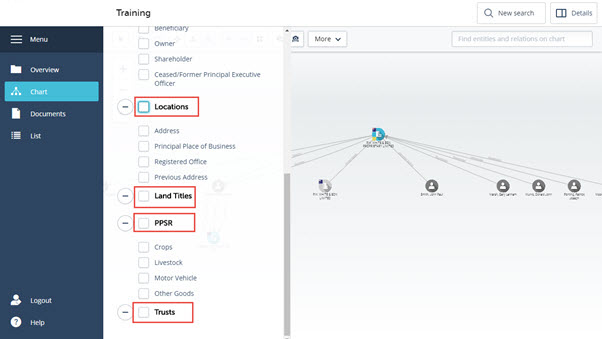
Here you will see all the Entities and their characteristics listed as filters.
- The first step is to de-select any of the Categories you do NOT want to see. In this example, please filter off – Locations, Land Titles, PPSR and Trusts
- Under Organisations, select Registered’ (This will show all Organisations in the displayed reports with a status of ‘Registered)
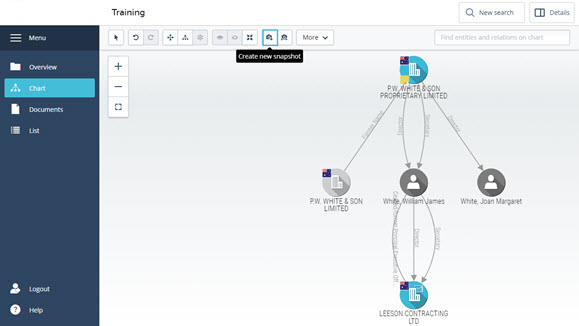
To see the changes, you may need to Close the Chart Filter panel, and apply a hierarchy layout to the chart.
- Continue to select the entities and characteristics you want to see in the chart.
- Take a Snapshot of the chart by clicking on the Create Snapshot Toolbar button
Comments
0 comments
Please sign in to leave a comment.